
Understanding xG: The Expected Goals Metric Analysts Rely On
Expected Goals, or xG, has become one of the core numbers you see on modern broadcasts, sitting next to shots and possession as if it has always been there. If you regularly watch full matches rather than just highlights, learning what xG actually measures—and what it leaves out—gives you a more grounded way to judge whether a performance was sustainable or just a night where every half-chance flew into the top corner.
What xG Really Measures When You See It On Screen
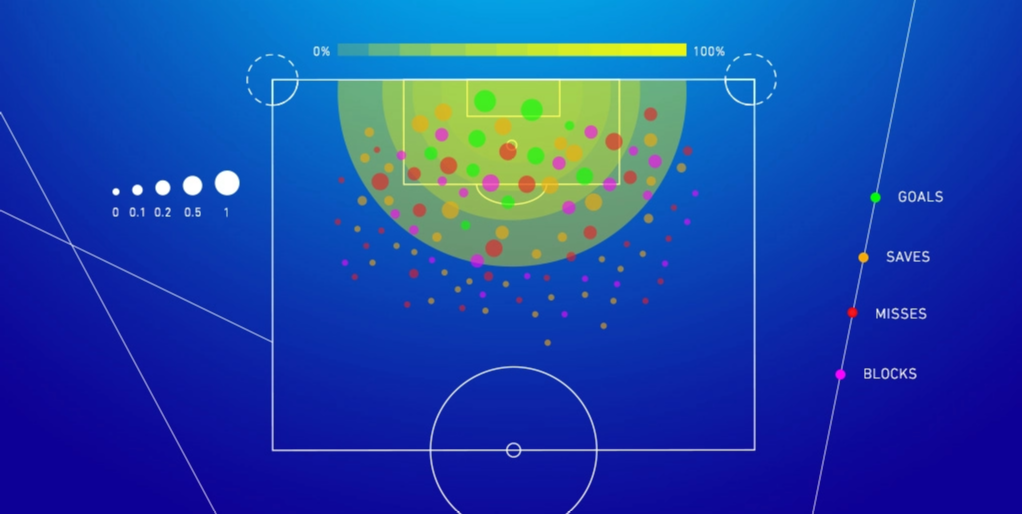
At its simplest, xG assigns every shot a probability between 0 and 1 that it will become a goal, based on how often similar chances led to goals in the past. A tap‑in from the six‑yard box might receive an xG of 0.7, while a long‑range effort under pressure could be 0.02, reflecting that 2 out of 100 similar attempts historically find the net. When broadcasters show a team with 2.1 xG, that number is the sum of all those probabilities, indicating roughly how many goals an average side might have been expected to score from the chances they created.
How xG Models Turn Thousands Of Shots Into A Single Value
xG models draw on large databases of past shots and look for patterns in the situations that usually produce goals. Core inputs typically include distance from goal, shooting angle, whether the chance was a header or a shot with the foot, and how the ball arrived—via a through ball, cross, cut‑back, set piece, or dribble. More advanced models also factor in things like defensive pressure, goalkeeper positioning, and aspects of the build‑up, but all of them ultimately answer the same question: given chances like this, how often do they go in over thousands of attempts?
Why xG Helps You Judge Performance Better Than Goals Alone
Because finishing is noisy from game to game, raw goals scored can make a team look brilliant one week and blunt the next, even if the underlying chance quality barely changed. xG filters some of that randomness by focusing on the quality of chances, so a side with 0.3 xG that wins 1–0 probably did not create much, while a side with 2.5 xG that draws 1–1 may have repeatedly carved the opponent open but finished poorly or met an in‑form goalkeeper. When you watch, tracking both goals and xG helps you separate repeatable patterns—like a team consistently generating high‑value shots—from one‑off moments like a long‑range screamer that will not appear every week.
How Watching Live Matches Makes xG Come Alive
When you ดูบอลสด and follow the entire match flow, you can connect the xG numbers you see later to the actual patterns that created them: cut‑backs from the byline, third‑man runs into the box, or constant crosses towards a dominant striker. Over 90 minutes you notice whether a team’s xG pile‑up comes from controlled territory and repeatable moves or from broken phases and scrappy rebounds that might not be reproduced next week. This link between what your eyes see and what the models capture makes xG feel less like an abstract graphic and more like a shorthand summary of the territorial and tactical pressure you have just watched.
What xG Can Tell You About Finishing Over Or Under Performance
Comparing a team’s or player’s actual goals to their xG over a run of games is a useful way to spot whether finishing is hot, cold, or roughly in line with chance quality. A striker who has 10 goals from 5 xG is probably either finishing at an exceptional level or riding a hot streak of difficult shots going in, whereas another with 10 goals from 12 xG is likely missing several high‑quality chances. When you watch, knowing those trends lets you interpret missed chances differently: a usually clinical forward underperforming xG for weeks might be playing through confidence or physical issues, while a lower‑profile striker continually finding high‑value shots may quietly be positioning himself better than headline numbers suggest.
Example Table: Reading Season‑Long xG vs Goals While Watching
When you look at seasonal xG charts during a broadcast, they are really pointing at how sustainable a player’s or team’s scoring might be if the pattern of chances continues. The simplified examples below show how to link different xG–goals profiles to what you see on the pitch.
| Profile Type | xG Total vs Goals Scored | What To Think While Watching Live |
| Hot finisher | 10 xG, 16 goals (well above xG) | Expect some regression; look closely at shot difficulty and technique |
| Wasteful but well‑served | 15 xG, 9 goals (below xG) | Team is creating; focus on movement and decision‑making in box |
| Low‑volume attack | 7 xG, 7 goals (both low) | Scoring matches xG; main issue is lack of chance creation |
Using these patterns during live viewing helps you avoid overreacting to one match’s scoreline, because you have a mental baseline for whether the underlying chance volume and quality support long‑term success. It also nudges your attention towards the movement and passing that generate high‑value shots rather than just the final touch that finishes them.
How xG Shapes Your Reading Of Match Flow And Tactical Choices
Over the course of a game, xG timelines reveal where the real territorial dominance lies in a way that basic shot counts and possession numbers cannot. A team with lots of low‑xG long shots may appear busy, but their cumulative xG will climb slowly, while a side that keeps playing into the six‑yard box may see sudden step‑changes even with fewer attempts. When a coach shifts from patient build‑up to more direct play late in a match, you can often see the type of chances—and therefore the xG profile—change as more balls are flashed across the box or lofted to a target forward.
A Simple Sequence For Using xG While You Watch
Instead of checking xG only at full-time, you can use it as a loose framework throughout a game to structure what you pay attention to. The following sequence keeps the focus on how chance quality develops rather than on raw shot totals.
- First 20 minutes: Note where shots come from and whether they are central or wide, in the box or from distance, imagining rough xG values rather than just counting attempts.
- Around half-time: Ask whether one side is consistently getting cut‑backs and close‑range looks while the other is limited to blocked efforts and speculative strikes.
- Between 60 and 75 minutes: Watch for tactical changes—formation tweaks, new forwards, more direct passing—and how quickly they produce higher‑value chances or just more low‑percentage shots.
- Final 15 minutes: Track whether the trailing team can create even one genuinely big chance rather than a flurry of hopeful efforts from the edge of the box.
- After the match: Compare your mental sense of which side created better chances with the xG numbers to test and refine your eye over time.
Following this structure makes xG feel less like a verdict imposed after the game and more like a language you are learning to speak in parallel with live play. It also builds a feedback loop: as you compare your observations with the post‑match data, you get better at judging chance quality in real time without needing the graphic.
Where xG Struggles And Why You Should Treat It As A Guide, Not A Judge
No model can capture everything that happens in a ช่องทางดูบอลสด โกลแดดดี้ match, and xG is no exception. Some models do not fully incorporate goalkeeper strength, defenders’ positioning, or psychological factors like pressure and fatigue, which means a high‑xG chance can still be stopped by an exceptional save or tightened angle that the numbers underweight. Over longer horizons, certain players consistently beat or lag behind their xG because of shot selection, technique, or heading ability that the underlying features only partially explain, so you should see xG as a strong baseline, not a courtroom verdict.
Summary
xG measures the quality of chances by comparing each shot to thousands of similar situations, giving you a clearer sense of how many goals a team or player should have scored based on their opportunities. When you combine that knowledge with full‑match viewing—tracking where shots come from, how they are created, and how often your eye’s impression matches the numbers—you gain a much sharper lens for judging performances than the scoreline alone. Used as a guide rather than a verdict, xG helps you interpret which attacking patterns are sustainable, which hot streaks are likely to cool, and how to re‑read both standout wins and frustrating draws when you watch future matches.